Solar Power Helped Keep the Lights On During California’s Recent Catastrophic Heat Wave
Electric service is one of the most vital public services in a modern society. Keeping the lights on every day and around the clock is an essential responsibility of our government, our utility regulators, and the institutions that run the grid minute-by-minute. That system broke down on August 14 and 15 in the evening when temperatures topped 100 degrees across most of the Western United States, and over 200,000 California utility customers suffered a brief blackout. The precise reasons for the breakdown are still being investigated, but you can see through the following charts that solar energy was a star performer and helped avoid a much worse breakdown in the electric system.
Chart 1 shows how much power was demanded by electric consumers served by big investor-owned utilities in California – PG&E, SCE and SDG&E – during the peak hour of each day from August 6 to 17 when customers’ power demand peaked. The peak hour is generally between 4 p.m. and 6 p.m. The chart also shows the sources of the power used on each day to supply this peak demand. The data comes from the California Independent System Operator (and excludes behind the meter solar, which offsets demand and which the CAISO does not see or include in its data). The charts were prepared by Tom Beach of Crossborder Energy, a consultant to Vote Solar as well as the solar industry. The chart shows how peak demand increased steadily throughout the week before Friday, August 14 and how solar performed consistently every day in the peak load hour.
Chart 1 – Gross Peak Load – August 6 to 17, 2020
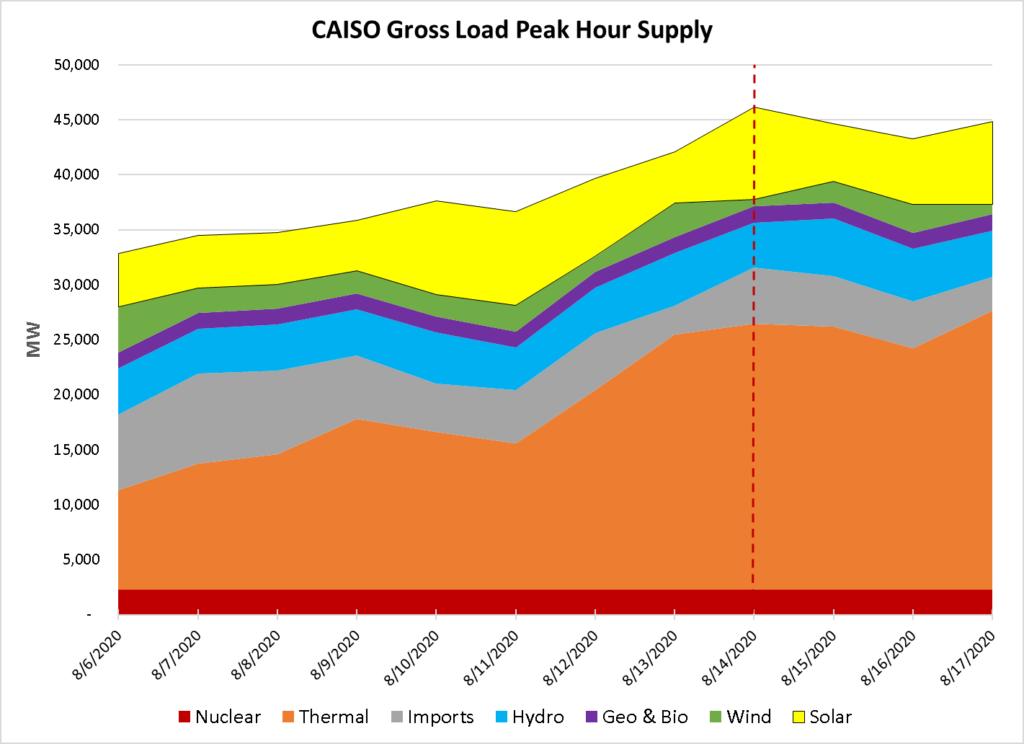
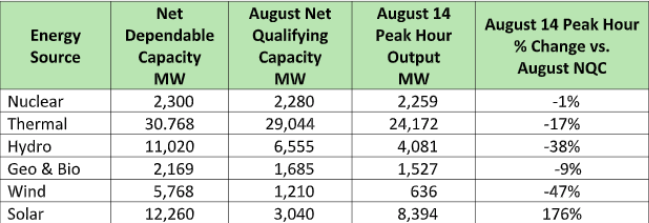
Table 1 below shows how each power resource contributed to meeting the peak requirements of the system, which occurred between 4 and 5 p.m. on August 14, 2020. This table requires a little explaining of the terms that are used. Every power plant has a net dependable (nameplate) capacity. That is the amount of energy that can be produced instantaneously by the plant under perfect conditions. For solar it means the amount of power that can be produced when the sun is directly overhead on a cool day. For wind it means the amount of power that can be produced when the wind is blowing at the optimal velocity.
For hydro it is the amount of power that can be produced with the maximum amount of water available. The term net qualifying capacity is the amount of power that the power system operator expects the technology to provide during the peak hour. This is the number that utility planners use when making sure the system is reliable. You can see from Table 1 that on August 14 between 4 and 5 p.m., solar far outperformed the amount of power that was expected from solar during the peak hour in August.
Table 1 : Performance of Resources on August 14, 2020
versus Resource Adequacy August NQCs
When the power interruption on August 14 began two hours later at 6:30 pm, the amount of solar had dropped as sunset approached. This underscores that California’s primary challenge these days is ensuring that there are adequate supplies of other sources of power for the later evening hours, when demand can still be high but the state’s abundant solar supplies drop off as the sun sets. To meet these evening peak demands, batteries and other forms of storage are becoming an increasingly important part of a clean energy system. California has been on the leading edge of battery installation. However, batteries still account for a very small amount of the resources we depend on (around 0.5% of all of the power sources).
Since batteries can respond very fast, they are often used to keep the system in balance throughout the day, which avoids wear and tear on slower responding sources of power. On August 14, you can see on Chart 2 below that batteries were able to provide about 150 megawatts of power from 6 to 8 pm when it was most needed. Californians can expect to see a lot more power from batteries in the future. As much as 3,300 megawatts of new batteries could be installed over the next two years, as a result of procurement ordered by CPUC. In addition, batteries are now being paired with solar systems so that they can operate as a single unit that can store the excess power that solar produces during the middle of the day, then discharge that solar power in the high-demand hours immediately after the sun sets. This essentially uses the batteries to extend solar output to the evening hours, which is when the recent blackouts occurred.
Chart 2: Battery Performance on August 14, 2020
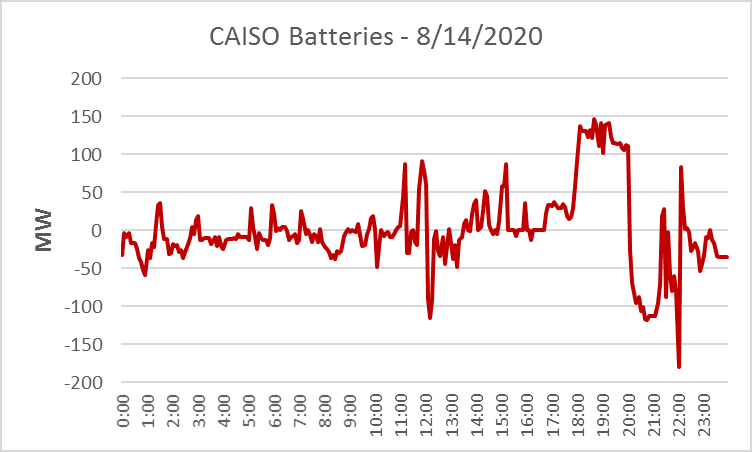
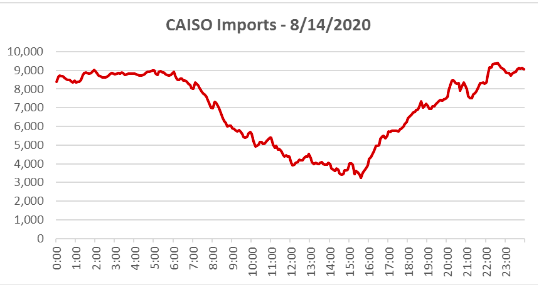
Chart 3 shows how much power was imported from outside California on August 14, 2020. In the summer, California typically imports power from the Pacific Northwest where there is excess power because of the cooler weather and abundant hydroelectric resources. The curve shows a drop off in imports during the midday when there was a lot of solar power in California.
The imports start to ramp up around 4 pm and continue through the evening. However, because it was very hot throughout the Western United States, there was less imported power available at 6 pm than expected. While this may have surprised the grid operators, they should expect that imports will be more uncertain in the future due to climate change and the closure of a number of coal power plants throughout the Western United States.
Chart 3: Power Imports on August 14, 2020
The bottom line is that California‘s investment in solar power has paid off. It has helped to keep the lights on as the state’s economy has grown over the past decade. Solar paired with storage, both large-scale and smaller behind the meter systems, is the solution for the future, and a key means to make solar an even more reliable power source. California’s policymakers need to order more of these projects if they want both to keep the lights on and tame the climate crisis.